WRM: ACS, Western Regional Meeting
NOC – National Organic Chemistry Symposium, ACS
CCCE Canadian Chemistry Conference
CERM: ACS Central Regional Meeting
MARM: ACS Mid Atlantic Regional Meeting
VaDDRx 2022: Cardiovascular, Pulmonary, and Metabolic Disease
MIKIW, Medicinal Chemistry Conference
OHSU Chemical Biology and Physiology Conference
High-Throughput Purification of Five Over-the-Counter & Prescription Drug Compounds by Reverse-Phase Preparative LC-MS
Instrumentation:
puriFlash® 5.250
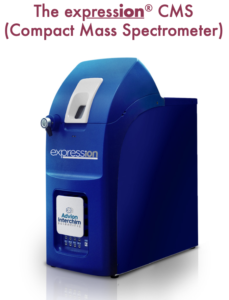
expression® CMS
Uptisphere® StrategyTM column US5C18HQ-150/300
Authors:
Advion Interchim Scientific, Montluçon, France Headquarters
Introduction
Purification is a critical step in drug development. From research, to scale-up to process, purification and confirmation are essential steps in bringing a drug to market. It is essential to have a high-throughput solution that offers sufficient quantity and reproducible quality of purified compounds. The separation of the active pharmaceutical ingredients (APIs) from their impurities can be easily achieved with a preparative chromatography system.
This application note features the purification of five active ingredients found in over-the-counter (OTC) drugs including caffeine, glafenine, ketoprofen, flavone, and fenofibrate (Figure 1), by a preparative purification workflow with confirmation using a compact mass spectrometer.
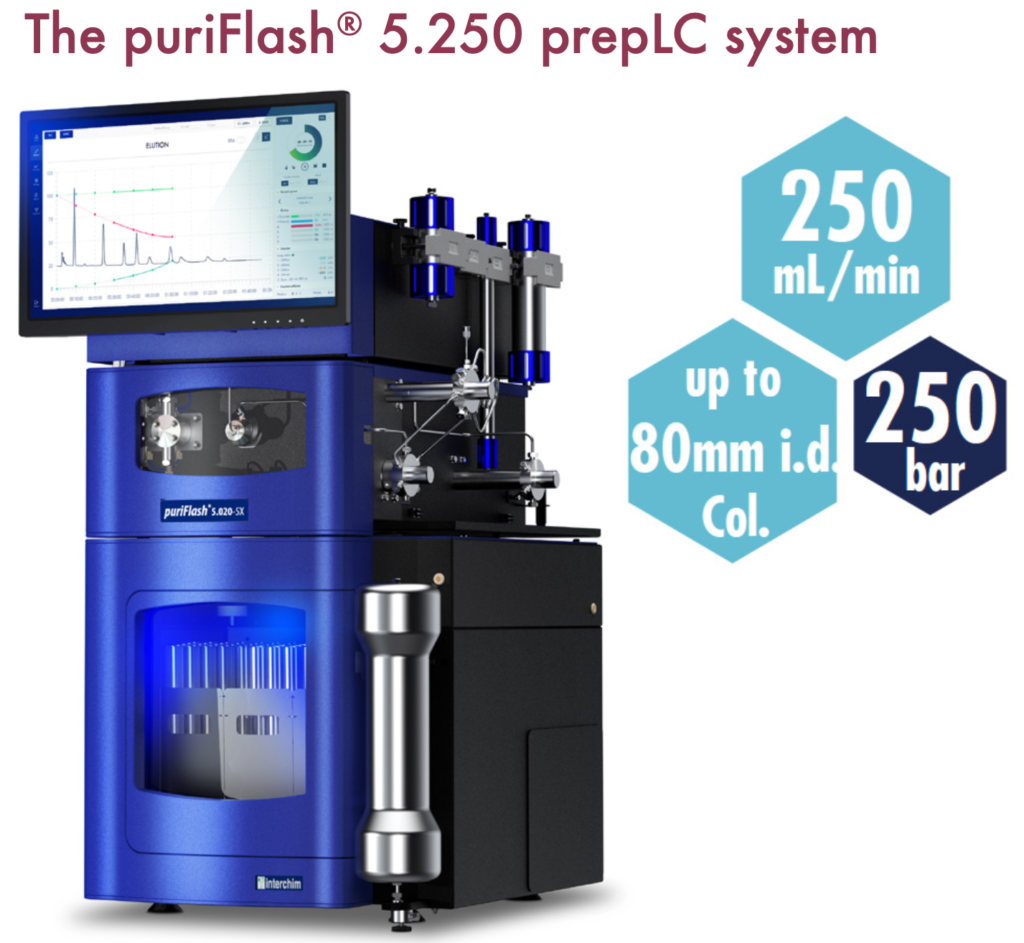
Figure 1: The five compounds of interest include caffeine, glafenine, ketoprofen, flavone, and fenofibrate. Chemical structures and pharmaceutical use cases are highlighted below.
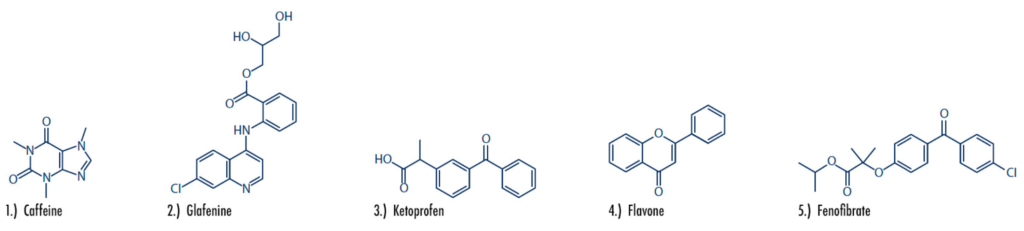
Caffeine: A natural chemical with stimulant effects, caffeine can be found purified in tablet form, or naturally occurring in coffee, tea, cocoa and more.
Glafenine: A nonsteroidal anti-inflammatory drug (NSAID), glafenine was removed from the market in 1991 due to a high risk of anaphylaxis.
Ketoprofen: A prescription-based nonsteroidal anti- inflammatory drug (NSAID), ketoprofen is used to treat inflammation, swelling, stiffness and joint pain. The drug was discontinued in 1995 due to increased risk of heart attack, stroke, irritation and other issues.
Flavone: A metabolite and nematicide that commonly exists in plants.
Fenofibrate: A prescription medication used to reduce and treat high cholesterol and triglyceride (fat-like substances) levels in the blood.
Experiment
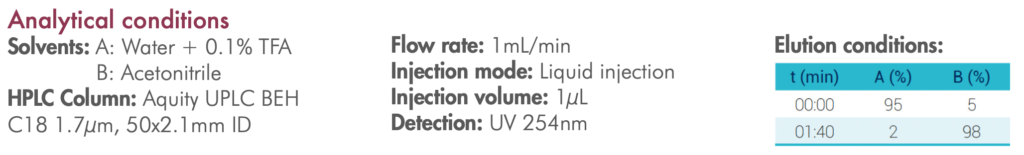
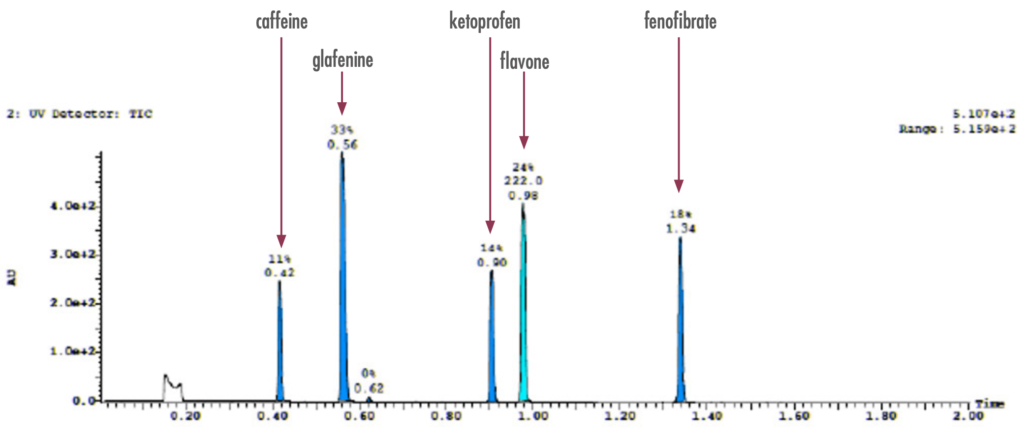
Exploratory LC Separation
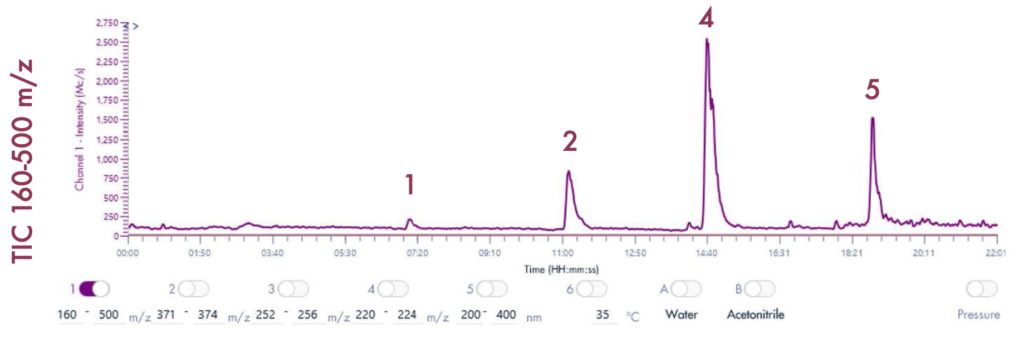
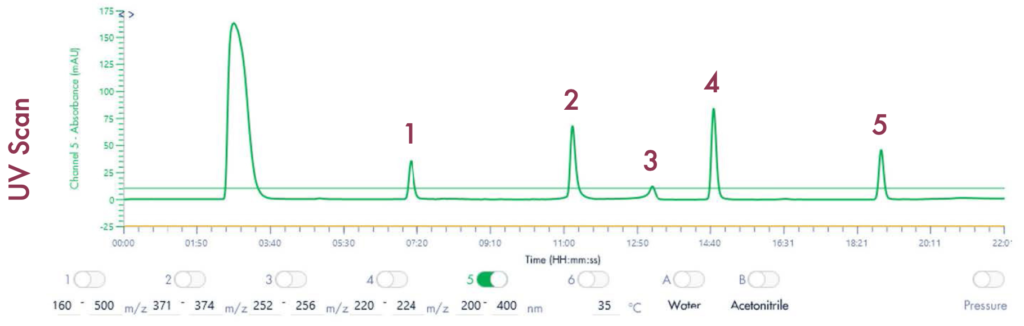
Figure 2: To confirm the presence of the pre-identified compounds, an exploratory LC-UV run confirmed the presence of the drug compounds prior to purification.
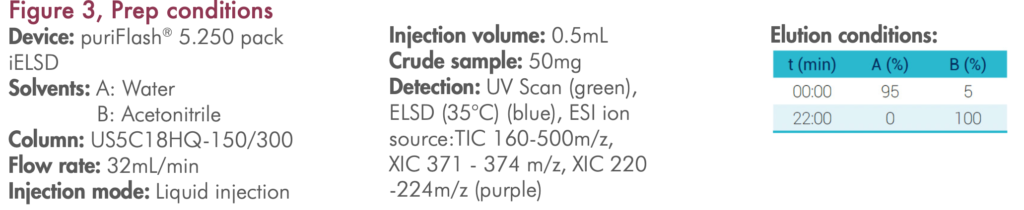
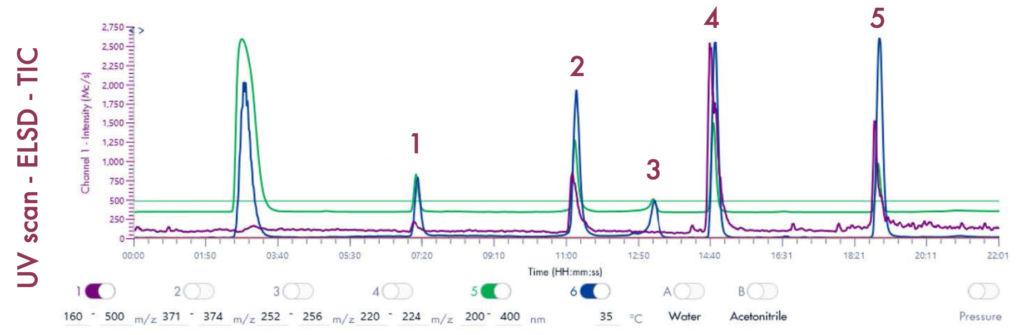
Preparative LC Run
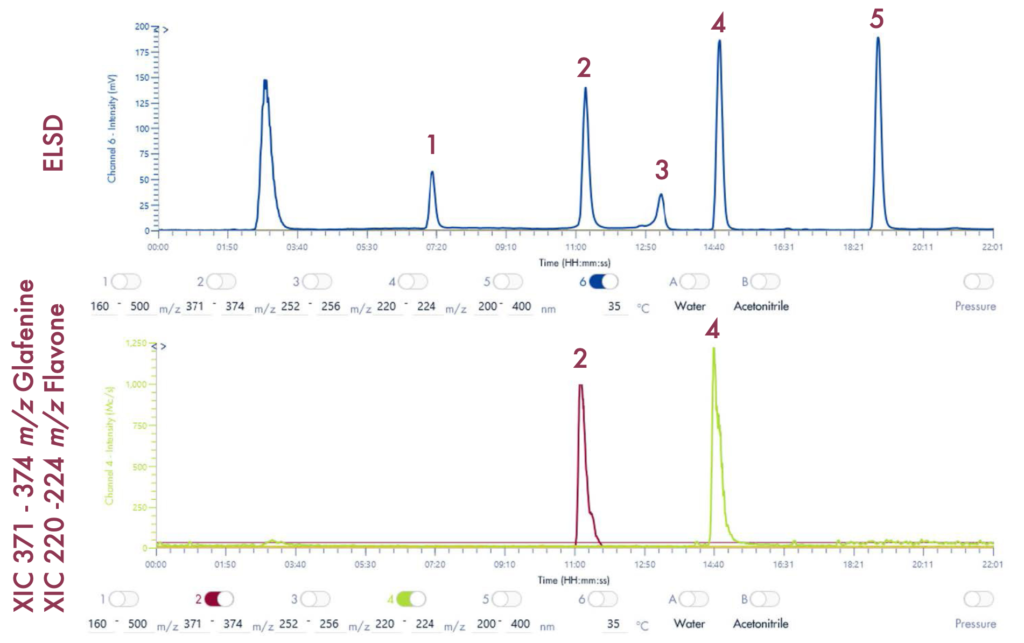
Following the positive ID of the five compounds of interest and their elution points, the drug mixture was then ready for a preparative LC-UV run on the puriFlash® 5.250 iELSD. The purification is aided by the iELSD pack, enabling the detection of chromophore-free compounds (Figure 3).
Results and Validation
Separation & Purification Results
The identity of the separated compounds was confirmed using the Advion Interchim Scientific expression® Compact Mass Spectrometer, quickly and accurately identifying the compounds of interest.
The purity of these compounds can be verified using analytical scale HPLC.